And The Election’s Winner Is…GIS!
As anyone who’s ever scoured raw county reports from a secretary of state page knows, election results are not easily digestible by nature. Raw numbers may have stories to tell, but humans process visual data, whether color-coded, textured, uniquely-shaped, or otherwise, much faster. That’s why major news outlets and academic institutions utilize spatial data and GIS to broadcast and analyze election results, both in real-time and years after.
In fact, some even use it in the lead-up, to predict results. FiveThirtyEight’s popular election prediction map for the 2020 presidential election allows users to move votes in and out of states, to see the possible electoral outcomes. The underpinnings of this are rooted in GIS and spatial data. The map must consider various elements, like if the state is a winner take all or proportional awarder of electoral votes, as well as precinct and district boundaries. This isn’t the only method people use to predict elections; Twitter tracks reactions and engagement to various news stories, and Amazon’s data regarding political book sales, when geocoded, can reveal trends polls might miss.
Once the votes are in, however, all eyes are on the actual results of the contest. This UCLA Sandbox article explains one process for creating a map that reflects the results of an election contest.
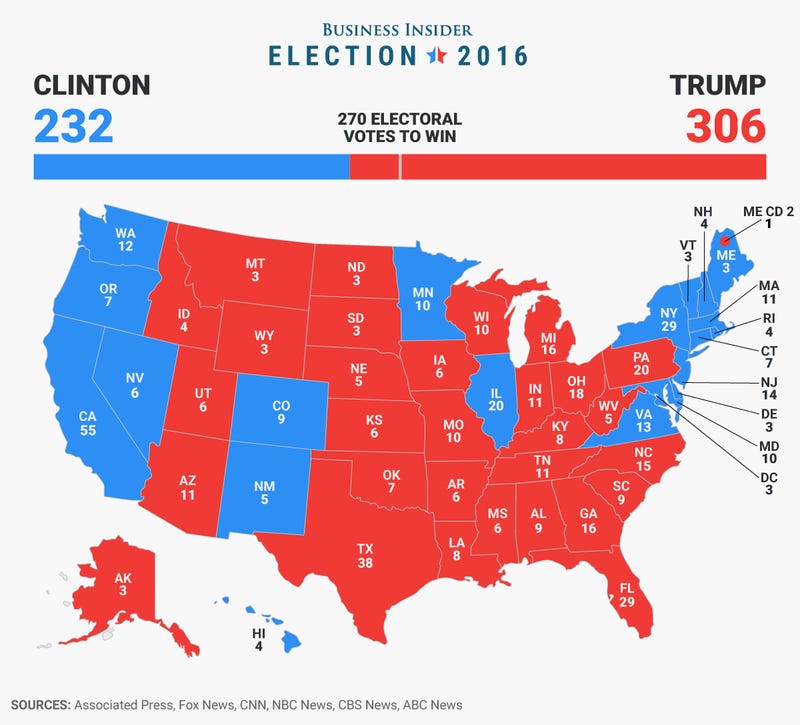
Election results, or, ‘tabular data,’ are essentially raw vote tallies in spreadsheet form. These are combined with state, county, or district geographic data. Once the two are paired and linked, numbers are assigned to locations on a map, and a digestible picture emerges. From there, color-coding can be applied, like in the US, where ‘red’ symbolizes Republican votes and ‘blue’ represents Democratic ones.
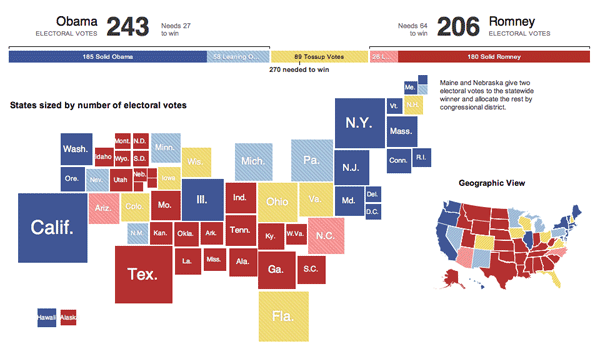
How the data is visualized is up to the content provider. This GIS Lounge article takes a look at the various forms of visualization utilized by major news providers after the US presidential election in 2012. An example of unique visualization comes from The New York Times, this map (seen below) displays state size to reflect the number of electoral votes each state has, the more electoral votes, the larger the box representing the state. The resulting map uses color (red for Republican, blue for Democrat, and yellow for Tossup) to display which way states voted in the 2012 presidential election.
Election analysis doesn’t end when winners are declared, though. Political scientists and journalists use past elections to glean insights about the country’s political attitudes. This study, for example, analyzes the increasing polarization of voters. Thanks to publicly shared shapefiles, precinct data, demographic data, and digital boundary definitions, this kind of analysis is not solely for the big-money major news networks anymore. GIS & other spatial technology have made it easier for all to understand election data and results through visualization.
See our other two blog posts on how geospatial information plays an important role in political campaigns & elections:
Increasing Fairness & Accessibility in Elections Through Spatial Data
How U.S. Election Campaigns Harness GIS Data For Voter Outreach
Increasing Fairness & Accessibility in Elections Through Spatial Data
In last week’s post, we detailed some of the ways political campaigns use GIS and spatial information to bolster their efforts. Just as contenders in those contests benefit from diverse data, so too can parties responsible for organizing and running those elections. The goal? To make voting freer, fairer, and more accessible.
In much the same way geo-tagging voters helps campaigns identify areas and addresses to target, the people who organize can use spatial data to communicate information, place voters in correct districts, and set up enough polling places to satisfy voter demand (thereby avoiding long lines at the polls). In 2019, NSGIC released a guide for GIS-enabled elections, which they made available here. The document outlines five best practices, which consist of hiring a team of specialists, creating and maintaining a voting unit GIS layer, developing a statewide geocoding strategy, assembling a contextual GIS layer, and implementing a data validation process.
Those practices are aimed at increasing voter turnout, making participation easier, and clarifying who should be voting where. At times, however, those goals seem at odds with existing districting systems.
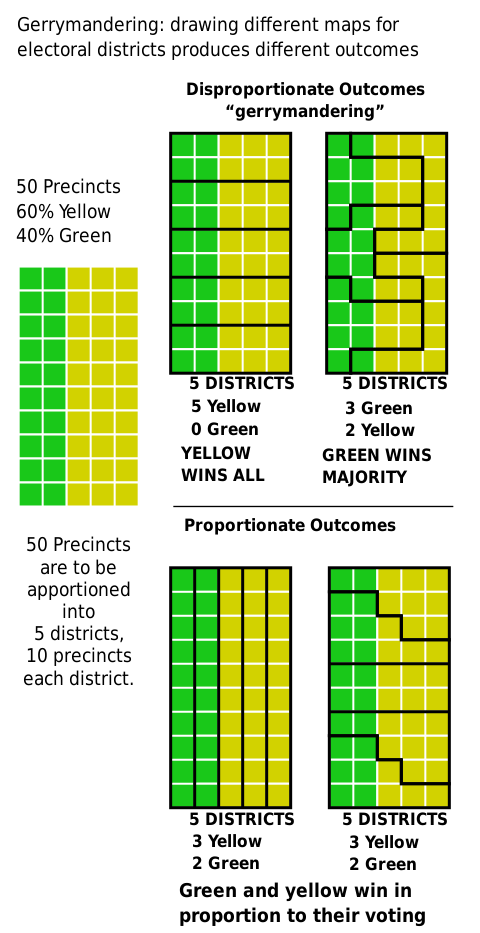
In the US (though the issue persists in other representative democracies), “gerrymandered” districts are something most voters can agree are unfair. Gerrymandering is the practice of manipulating district boundaries to tip the balance in favor of one party or another. In the US, efforts to stymie gerrymandering have been met with resistance from law makers, despite the practice’s unpopularity. The result is an electoral map filled with shapes only an incumbent could love.
Diagram courtesy of M. Boli, CC BY 4.0
Luckily, spatial data has no political affiliations or aspirations, and leveraging its objectivity is a way to increase the fairness and accessibility of elections in systems like that in the US. And with 2020 census data on the horizon, a new way forward is possible.
As detailed in this article from GIS Lounge, there are specific indicators that point to an un-tenably gerrymandered district. Voting history and district’s boundaries are compared against data like demographic breakdowns, landscape features, income averages, metrics of shape, and other local factors.
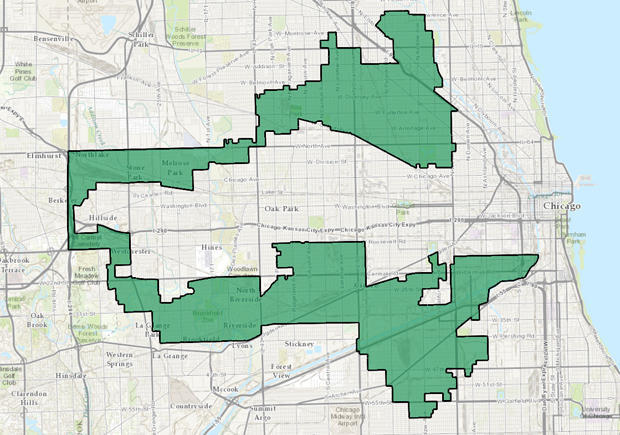
A gerrymandered district in Illinois. Image courtesy of CBS News.
This study by Kamyoung Kim of Kyungpook National University’s Department of Geography Education details a specific approach for optimizing spatial data to detect biased districts, called the capacitated double p-median problem with preference (CDPMP-P) approach. This approach analyzes a district’s spatial data, population relative to representation, and whether or not the voting infrastructure is robust. If the area scores high, it is likely not gerrymandered. A low score, however, means that district may need a democratic overhaul.
With these tools, election officials and organizers can help shepherd electorates around the world into a fairer democratic future.
How U.S. Election Campaigns Harness GIS Data For Voter Outreach
In previous posts, we’ve covered how governments utilize GIS and diverse spatial data to respond to crises and plan for future ones. In nations with electoral systems like the United States, people who want ‘in’ to the government utilize much of that same information to run their campaigns and spur voter turnout.
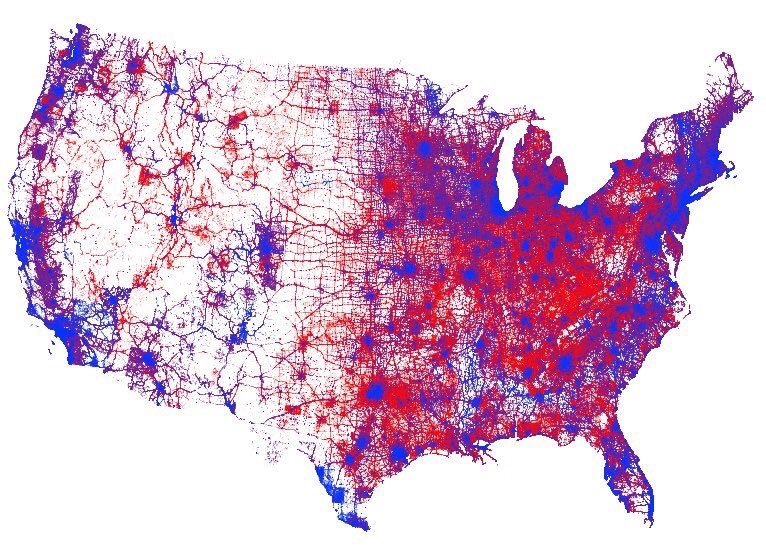
A visual representation of every vote cast in the 2016 United States presidential election. Image courtesy of Kenneth Field and Esri.
Since the early 2000s, (or at least as far back as 2004) political campaigns have added ‘microtargeting’ to their tool kits – essentially turning direct marketing methods into outreach tools for campaigns.
In this post from 2008, Karsten Vennemann of Terra GIS describes his experience working for the Obama campaign. Back then, he made use of open-source technology to identify and target specific voters. Put simply, the process allowed the campaign to lay voter data over base layers like precinct and county boundaries. The approach was so well liked, according to Vennemann, it was implemented in roughly a dozen highly contested states.
Today, tools like those offered by Esri’s ArcGIS have streamlined that process of turning addresses into useable data points. The first step is turning a list of addresses into a ‘geocoded’ list of voters. To do this, tools like Esri’s Tapestry Segmentation will analyze neighborhoods by socioeconomic and demographic factors. The program then classifies neighborhoods using 67 categories of market segments based on information like income, hobbies, education, and religious affiliation. Combine the Tapestry information with a list of addresses, and a picture of potential voters and donors emerges.
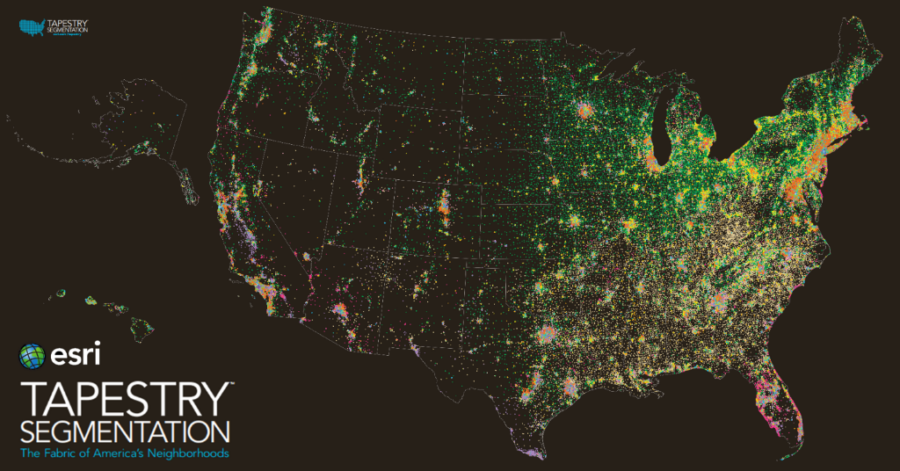
Esri Tapestry information of potential donors & voters. Image courtesy of Esri.
When that data is combined with information about boundaries and districts, campaigns can begin formulating ground plans. They can focus their attention on areas with potential support, while also avoiding areas where their cause may be hopeless. Essentially, this eliminates figuring out where to door-knock the hard way.
In today’s world of online data, evolving voter habits, and other factors, the ways in which this approach can be applied will likely continue to evolve. In next week’s post, we’ll take a look at how governments can use these same tools to ensure fair, accurate elections.
Mapping Efforts Move Forward in the Age of a Pandemic
Doing business in the era of COVID-19 means navigating around office closures, travel restrictions, and other roadblocks. For cartographers & GIS teams, who often work in a collaborative environment, and by leveraging large datasets sitting on local servers, this reality could present major problems.
Thankfully, current technology and strong, pre-existing relationships between data providers and map publishers worldwide allow for remote work where it was once not feasible. This has kept an essential industry running in uncertain times.
The East View Geospatial cartographic team found itself at the forefront of this phenomenon earlier this year when it produced mapping of the Polynesian island nation of Samoa.
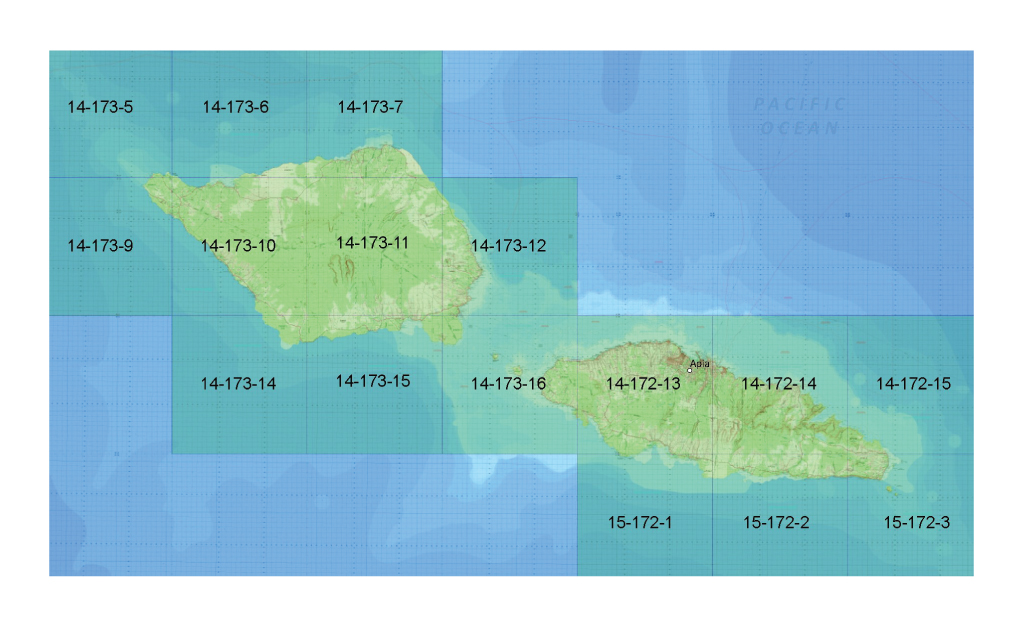 The mosaic of all 16 sheets over Samoa produced by EVG.
Just prior to its work in Samoa, the EVG production team published 16 topographic maps over Tanzania after identifying gaps in the series’ coverage. This effort thereby helped complete the Tanzania 1:50,000 topographic map series for the first time in the nation’s history (this story map tells that story).


In their efforts to execute the map production efficiently, accurately and up to MTM Mil-Spec requirements, the team utilized a suite of workflow enhancement tools developed by the Esri Defense Mapping Team, just as they had in their Tanzania work. These tools streamlined the production process and the team’s expertise with said technology made the completion of the Samoan map series possible.
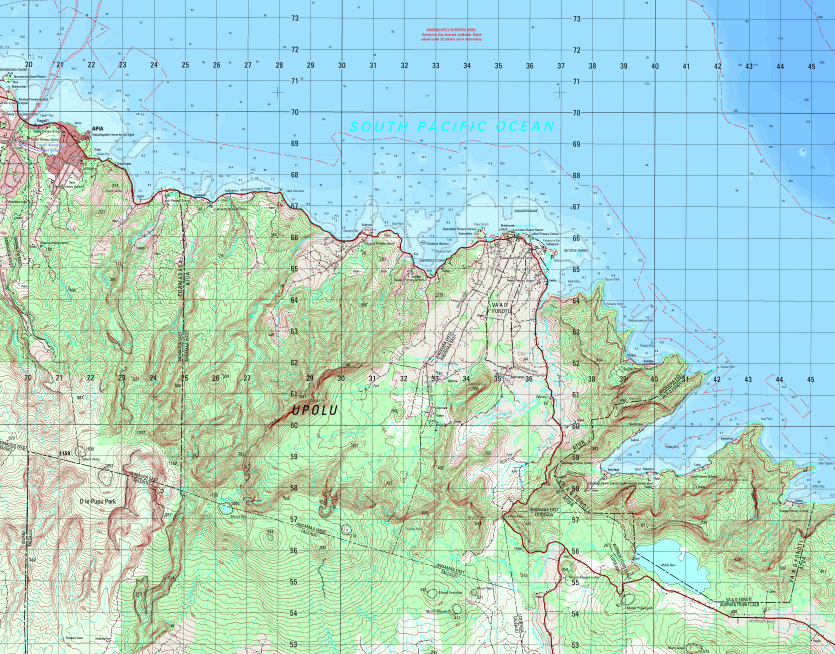
One of the topographic map sheets over Samoa produced by the EVG cartographic team.
In the end, our cartographic team produced & published a series of 1:50,000 scale topographic mapping comprised of 16 map sheets over Samoa. This series is the most recent addition to the EVMap catalog that includes datasets over Tanzania, Nigeria, Mexico and Myanmar. The production of this map series was executed 100% remotely and completed in 50% of the time estimated.
Mapping in the era of COVID may come with complications, but with the right tools in the right hands, precise, ground-breaking mapping projects can seamlessly move forward.
Watch the short video below to see how the EVG cartographic team mapped Samoa in the age of a pandemic:
Wandering in the World of Open Source Data
There is more data in the palms of our hands than ever before, and even for industries built on selling access to now-free information, there is a silver lining. Access to publicly available data is heightening everyone’s imaginations, and, in doing so, is stimulating demand for further expertise in data science and technology to harness its full potential.
For specific outcomes, though, expertise is needed. Many companies and individuals, while cognizant of this open data revolution in which we find ourselves, still need assistance in both sourcing the appropriate data as well as leveraging it to reap intended outcomes. To illustrate the demand for and value of data science and technology expertise, detailed below are recent projects leveraging open-source data.
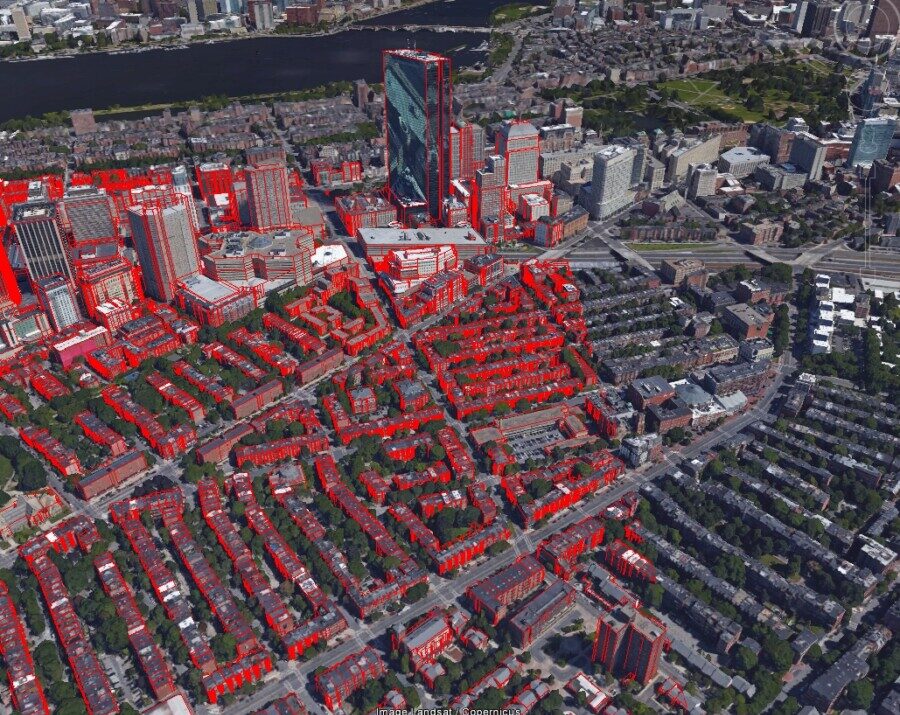
Building height data produced by EVG, shown in red, compared to real building size to show accuracy.
Satellite and aerial imagery represent another data type that has become exponentially more pervasive in the public domain, and these remotely sensed datasets can enable the creation of innumerable derivative products and applications. Good examples of these include satellite-borne images from the Landsat Missions, made available through NASA and USGS, and Sentinel-2, made available through the European Space Agency. Many are unaware of the existence of such imagery. Or, even if they are aware, they may struggle to exploit the data into meaningful outcomes. That’s where solution providers, like East View Geospatial, come into play.
In another notable case, EVG was able to utilize Landsat imagery over Costa Rica from 2015-2018 to perform a detailed change detection study on behalf of our client. This publicly available imagery allowed us to quickly analyze land cover and canopy changes over the country during a time when Costa Rica had experienced two major hurricanes. The data outputs we provided allowed the client to evaluate the extent of the environmental impact as well as their post-disaster response.
Satellite imagery over Costa Rica compared to land use/land cover data over the same area.
In both cases, EVG’s knowledge of public data & access to difficult-to-source data through National Mapping Agencies combined with our technical expertise enabled an agile solution. Aggregating free data, analyzing, conflating it with other datasets and delivering on a plan of action is something that has become integral to our operation since its inception. Growing access to free data has ushered out many traditional models of selling data but, most importantly, it has presented new opportunities to bring forth creative solutions to today’s most difficult challenges.