Geospatial Terms Made Easy: What is MTM?
East View Geospatial (EVG) has been a provider and producer of top-of-the-line maps, charts, geospatial datasets, and models for over 25 years. Spatial data and its derivative products have countless applications, and some of those applications require these products to meet very specific criteria. Maps, charts, and geospatial data used in military operations must adhere to “MTM standards”. We asked Jason Sjolander, our GIS Technical Manager, about MTM specifications and why adhering to standardization is important in the realm of defense mapping.
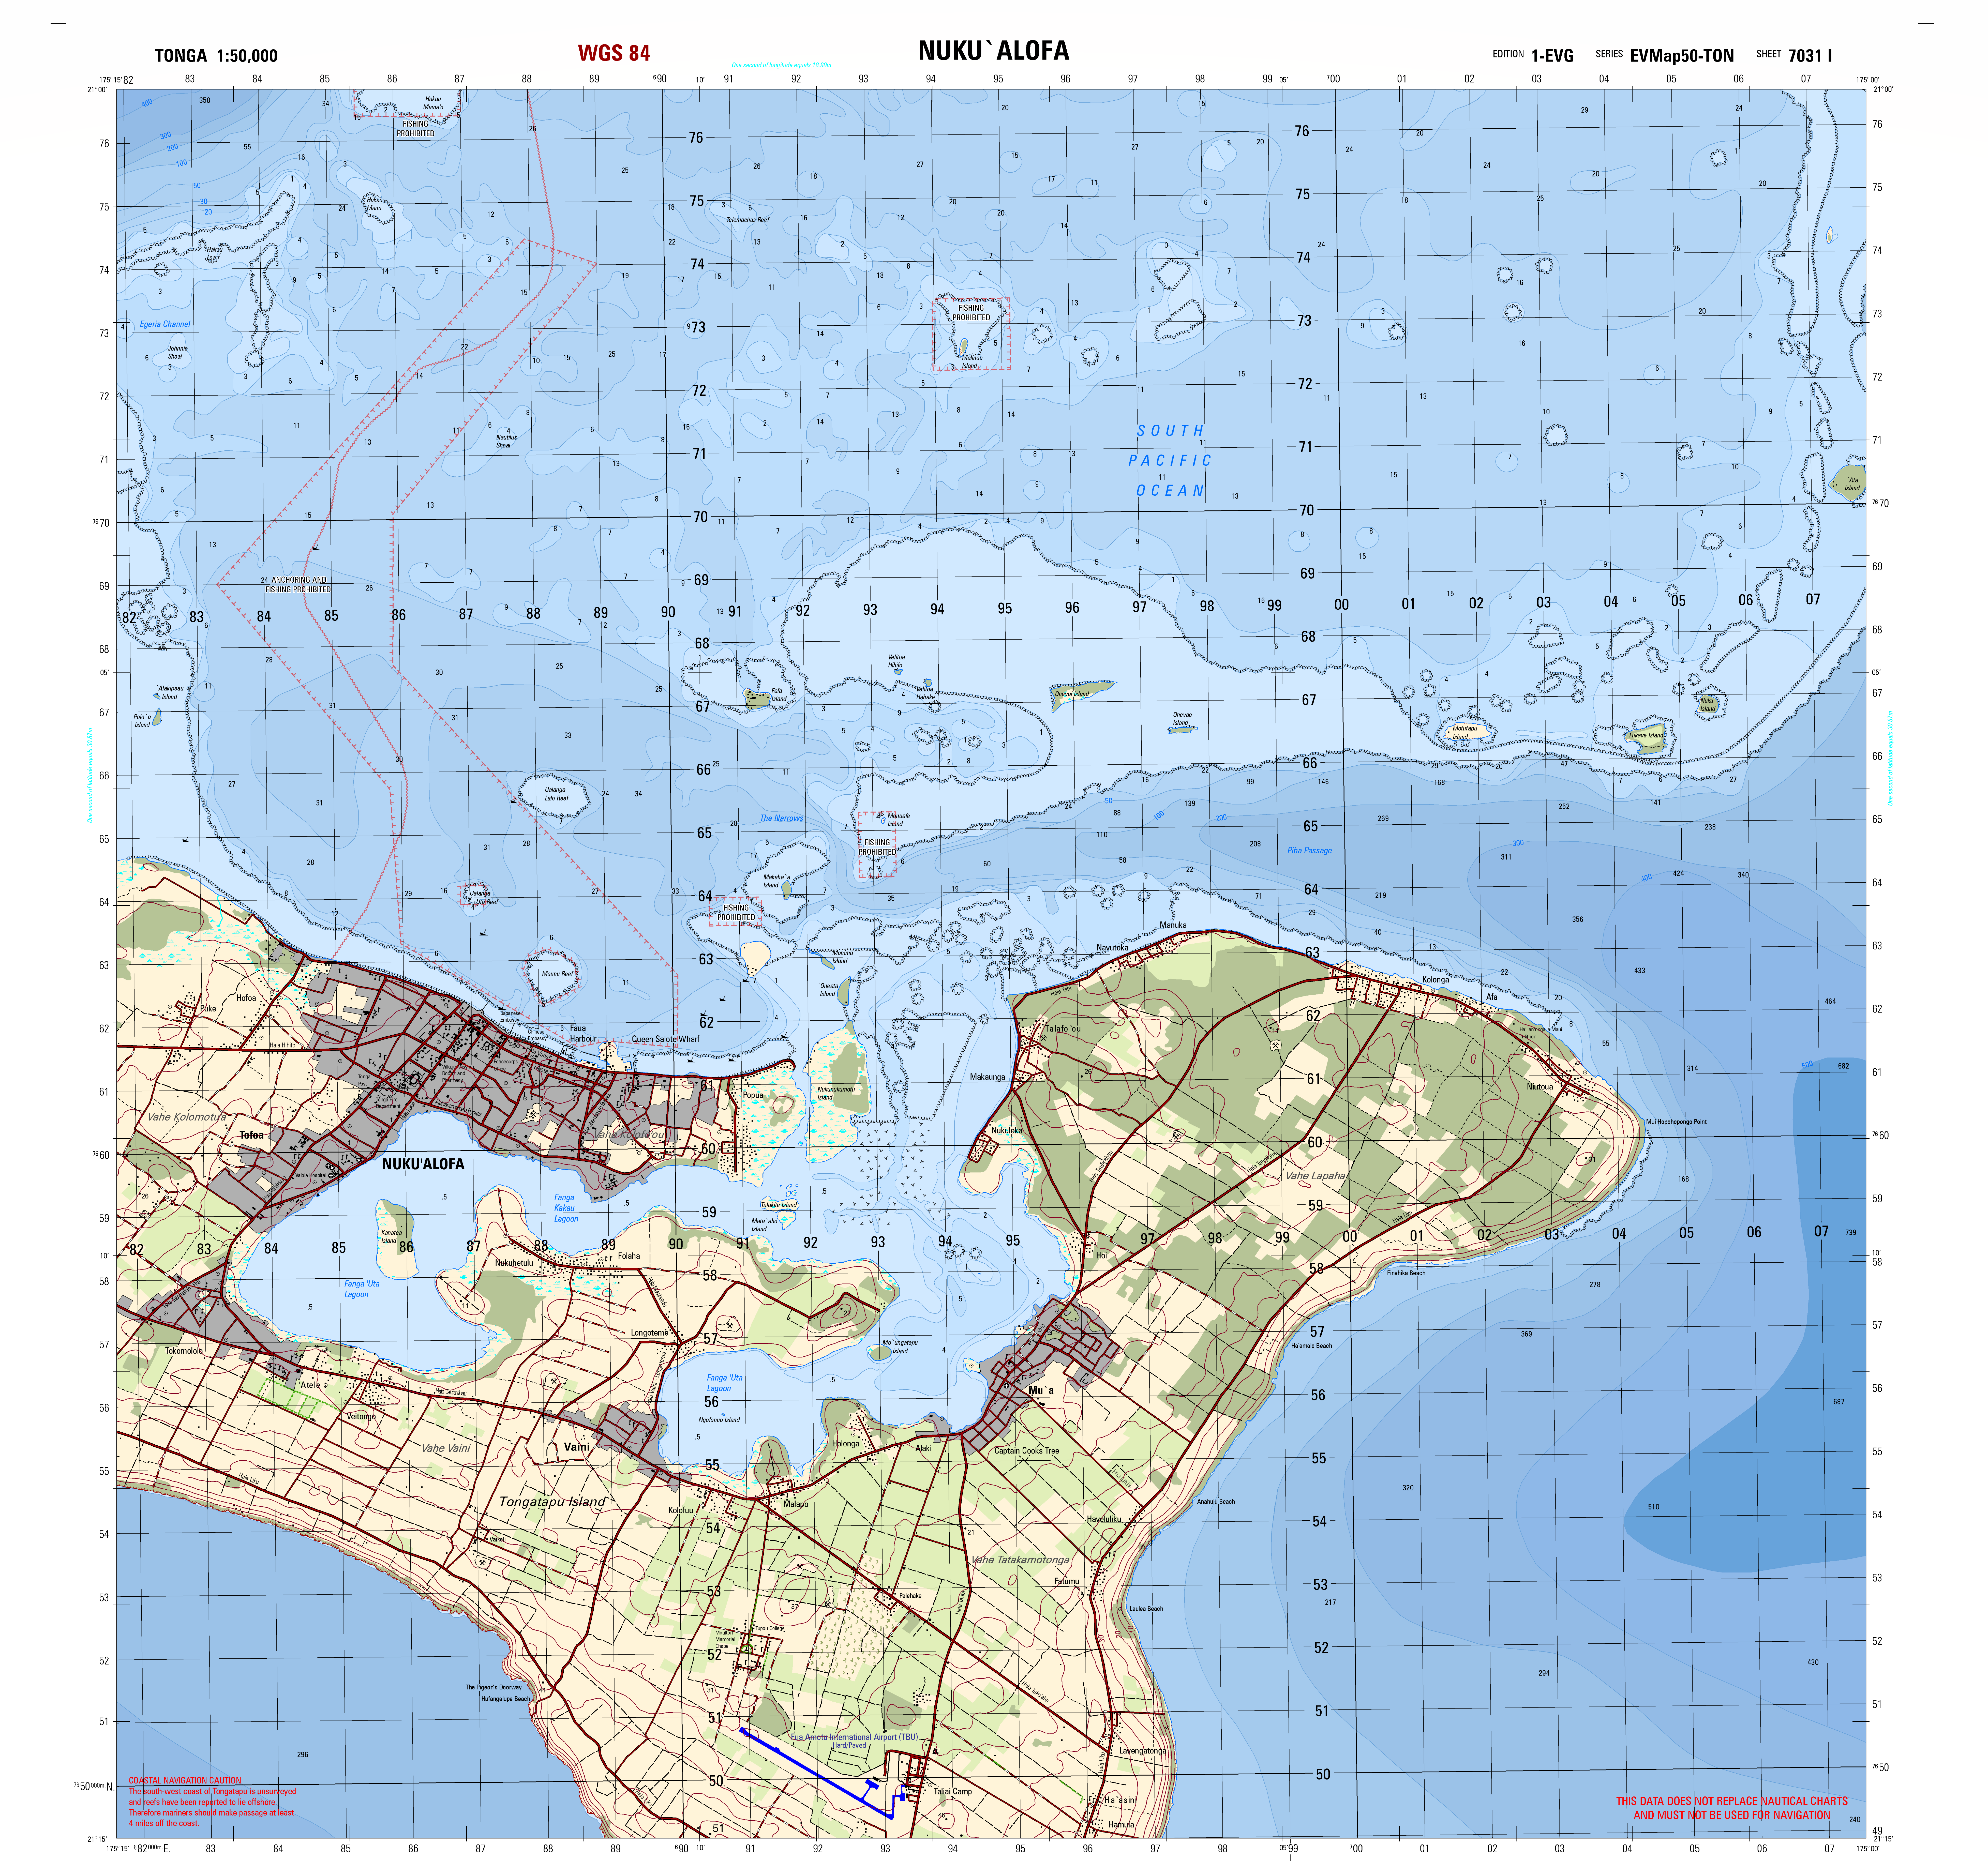
A 1:50,000 scale MTM map of Tonga produced by East View Geospatial.
What is MTM?
“MTM is an acronym of a defense mapping product. Its full name is Multinational Geospatial Co-Production Program Topographic Map. The Multinational Geospatial Co-Production Program or MGCP is a 32+ member group of nations across the world whom contribute information to a central database. This database amongst many things contains GIS data which is used to make MTM’s. Many mapping programs across the world have tools that run exclusively on this MGCP data, most notably ESRI and their Defense Mapping toolset. “
How does this apply to your work at EVG?
“At several points during my career at East View Geospatial, I have created MTMs at both the 50K and 100K scales. Having a standardized map setup like MTM allows for a more efficient workflow and production time and delivers a ready-to-use product to end users. “
Producing MTM maps is just one of the many things we do at EVG. We know how important it is to create maps, charts, datasets, and other geospatial products that meet our clients’ exact needs. We’ll work with you to ensure that the product you need is created to exact specifications no matter the end-use application. Contact us to find out how we can help you utilize maps, charts, and geospatial products today!

Jason Sjolander, GIS Technical Manager
Geospatial Terms Made Easy: What Is Raster and Vector Data?
Data drives all cartography- without it, maps couldn’t be made. There are countless types of data- each delivering their own unique value and insights. However, all types of mapping data fall into one of two categories: Vector Data or Raster Data. We spoke with Geospatial Analyst, Kelli Hercules, about why raster and vector data are important, how they differ, and their respective benefits when it comes to displaying specific data.
“Vector data is made up of points, lines, and polygons; all of which are used to represent real-world features in maps. All geometry types store information in x/y coordinates.
For EVG’s use of vector data:
- Point data usually represents small features, such as small buildings, pylons, landmark significant features.
- Line data represents features, such as: transportation (roads, cart tracks, trails), rivers, cables, pipelines.
- Polygon data represents features, such as: land cover, area hydrography, large buildings, city/county/state/country boundaries.

(Image courtesy of firenorth.org.au)
Raster data is made of pixels that are compiled into rows and columns. Primarily you will see raster data used in digital aerial photographs, satellite imagery, or even digital pictures. However, raster data can be organized into two separate categories, discrete data & continuous data.
- Discrete rasters are easy to distinguish as the data is organized into themes. Where one value might represent land cover, another may represent a river.
- Continuous rasters represent values that are above/below sea level. Digital elevation models are a good example of continuous raster data.”
How does this apply to your work at EVG?
“Both raster and vector data are important for our day to day tasks here at East View Geospatial. When we source data in-house, the data would be procured as a vector (points, lines, and polygons). This data is amassed in four different areas/themes: Hydrography, Transportation, Culture, and Land Cover. These two data types can also be utilized simultaneously. Raster data is necessary for feature data collection, in which the data being collected is vector data. Whether we procure our data or use data from other sources, vector and raster data are at the core of what we do here at East View Geospatial.”
Raster data and vector data are the base of all things geospatial. At the most granular level, all datasets will either be a raster dataset or vector dataset. With the cartographic process becoming almost 100% digital, it is crucial for cartographers to fully understand the differences and nuances of both types of data.

Kelli Hercules, Geospatial Analyst
Geospatial Terms Made Easy: What is a GeoMosaic?
Maps come in all shapes, sizes, and scales. Often, it can be difficult to find a map that displays the entire geographic area you want to see at the correct scale- either the scale is too small, or there are multiple sheets at a larger scale that do not cohesively blend. This is where geomosaics come in handy. This process allows map sheets to be joined seamlessly, allowing the viewer to see an area larger than what could be displayed on single paper maps. We asked our Director of Operations, Daron Anderson, about why geomosaics are so important in the comprehension and interpretation of maps and geospatial data.
“A geomosaic is a merge of two or more raster images. Geomosaics are ideal for distributing large amounts of raster data in a compressed and efficient way. Topographic maps, thematic maps, digital elevation models or imagery could all be types of raster images used to create a geomosaic. Geomosaics provide seamless map coverage over a certain location or region, making it easier to pinpoint and personalize the geographic area you want to see. There are many formats of geomosaics, which include: GeoTIFF, ECW, JPEG2000, GeoPackage and MBTiles.

PICTURED: A GeoMosaic of Myanmar. You can see the different boundaries for the sheets, but they are seamlessly integrated together on our MapVault service.
How does this apply to your work at EVG?
EVG has thousands of authoritative raster map series, in many formats all over the world. By creating geomosaics, we can make discovery and ease of use very simple. Use cases for geomosaics include basemaps, discovery, research and presentation. EVG geomosaics can be served to our clients via web services, including our own streaming service MapVault. In short, geomosaics allow people to view several map sheets simultaneously and seamlessly, making it easier to view and analyze specific geographic areas.”
Geomosaics represent a fusion of old and new technology- it allows historic maps in analog format to be digitized, georeferenced, and fused with other maps to display large-area seamless coverage. Our MapVault web mapping tile services allow clients to see all the different map sheets and series that we offer and choose which specific sheets they’d like to see. Geomosaics make maps faster and easier to view and understand, as they can be tailored to show specific geographic areas that could not be observed in the traditional sheet format.

Daron Anderson, Director of Operations
Geospatial Terms Made Easy: What is GEOINT?
Geospatial data has many applications. With the continued advancement of technology, geospatial data has been used increasingly in defense and intelligence communities. This information can make or break key decision-making within the intelligence community. For example, Remote sensing technology allows for tracking activity that may have not been disclosed publicly while at great distances. We talked to East View Geospatial Sales & Marketing Director, Jonathan Thompson, about what GEOINT is and why it’s so important.
“The US Government defines GeoINT or Geospatial Intelligence, as the exploitation and analysis of imagery and geospatial information to describe, assess, and visually depict physical features and geographically referenced activities on the earth.
GEOINT is made up of three key elements: geospatial information, imagery, and imagery intelligence.
EVG regularly sources, produces, and supplies geospatial information, including topographic and scientific mapping, human geography datasets, local geonames, and transportation networks to name a few. These are key geospatial information inputs in the intelligence process.
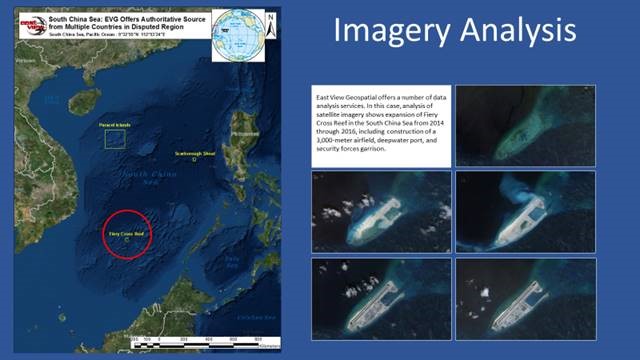
Moreover, EVG engages in imagery intelligence and imagery interpretation. Whether it be satellite-borne, airborne, electromagnetic, radar, or synthetic, we provide and analyze all types, formats, and resolutions of remotely sensed data for imagery intelligence and analysis. “
The evolution of geospatial information has equipped defense and intelligence agencies with the ultimate decision-making tools. By utilizing readily available data and performing deep analysis & interpretation on an ever-growing amount of remotely sensed data, the intelligence community can better evaluate opportunities, and threats. As the world continues to change and countries all over the world are trying to position themselves for the best future, geospatial intelligence will be a crucial element in their long-term success.

Jonathan Thompson, Director of Sales & Marketing
Geospatial Terms Made Easy: What is Metadata?

In simple terms, Metadata is the background information about datasets (Ex: The publish year of a map is one point of metadata for that specific map). What’s the advantage of having metadata? It allows users to discover and better understand their data. We asked Vansa Kroeng, Lead GeoData Specialist at EVG, to explain metadata and why it’s important within the geospatial industry.
“Metadata is data within data. It is the description of data and is used to explain the context surrounding the data. You can use metadata to summarize any additional information about the data such as publisher, status, publish year, along with other elements. These pieces of information make data easier to find and manipulate in a database.”
How does this apply to your work at EVG?
“At EVG, I am part of the Geodata team where I work to maintain our knowledge database of global mapping and data. Our database has many different types of geographic data, and each data contains its own metadata. For example, we may receive a series of topographic maps where each individual sheet in the series has a different index, name, publish year, edition, or other piece of information. Anytime we receive data, it’s the GeoData Department’s duty to catalog all the metadata. After the metadata is cataloged, it is then entered into our database. Metadata in our database helps provide any information an EVG team member may need in order sell, advertise, or understand a specific map series or sheet. In addition, customers can leverage metadata to better understand a map or geospatial product. Metadata may provide context about when and where a geospatial dataset was produced. It can also provide additional details that are not displayed with symbology. “
Our comprehensive metadata collection is part of what sets EVG apart in the geospatial market. Details and additional information help to make products, services, and solutions more discoverable and useful, creating a better experience for our customers.

Vansa Kroeng, Lead GeoData Specialist