Key Takeaways
- In COVID-19 vaccination efforts, leveraging spatial information is essential in planning, distribution and post-vaccination tracking
- In the planning phase, spatial data helps identify vaccine distribution sites and priority populations
- Following vaccination, spatial information can be used to track how many people have received doses and predict when populations will reach herd immunity
- GIS can be used to boost the transparency of vaccination efforts to promote greater public trust
In the battle against COVID-19, developing a vaccine was one step toward victory. Now the world needs logistics experts to distribute the vaccines accurately, equitably, and quickly. Location-based data analysis has proven to be an essential tool for these experts.
The Centers for Disease Control (CDC) and miscellaneous health groups have been using spatial data since the onset of the pandemic. In a recent article on GovConWire, chief of commercial mission integration at the US’ National Geospatial-Intelligence Agency (NGA) Juan Sainz noted that geospatial data usage increased by over 100% and there was an influx of new users since COVID-19’s arrival in the winter of 2020.
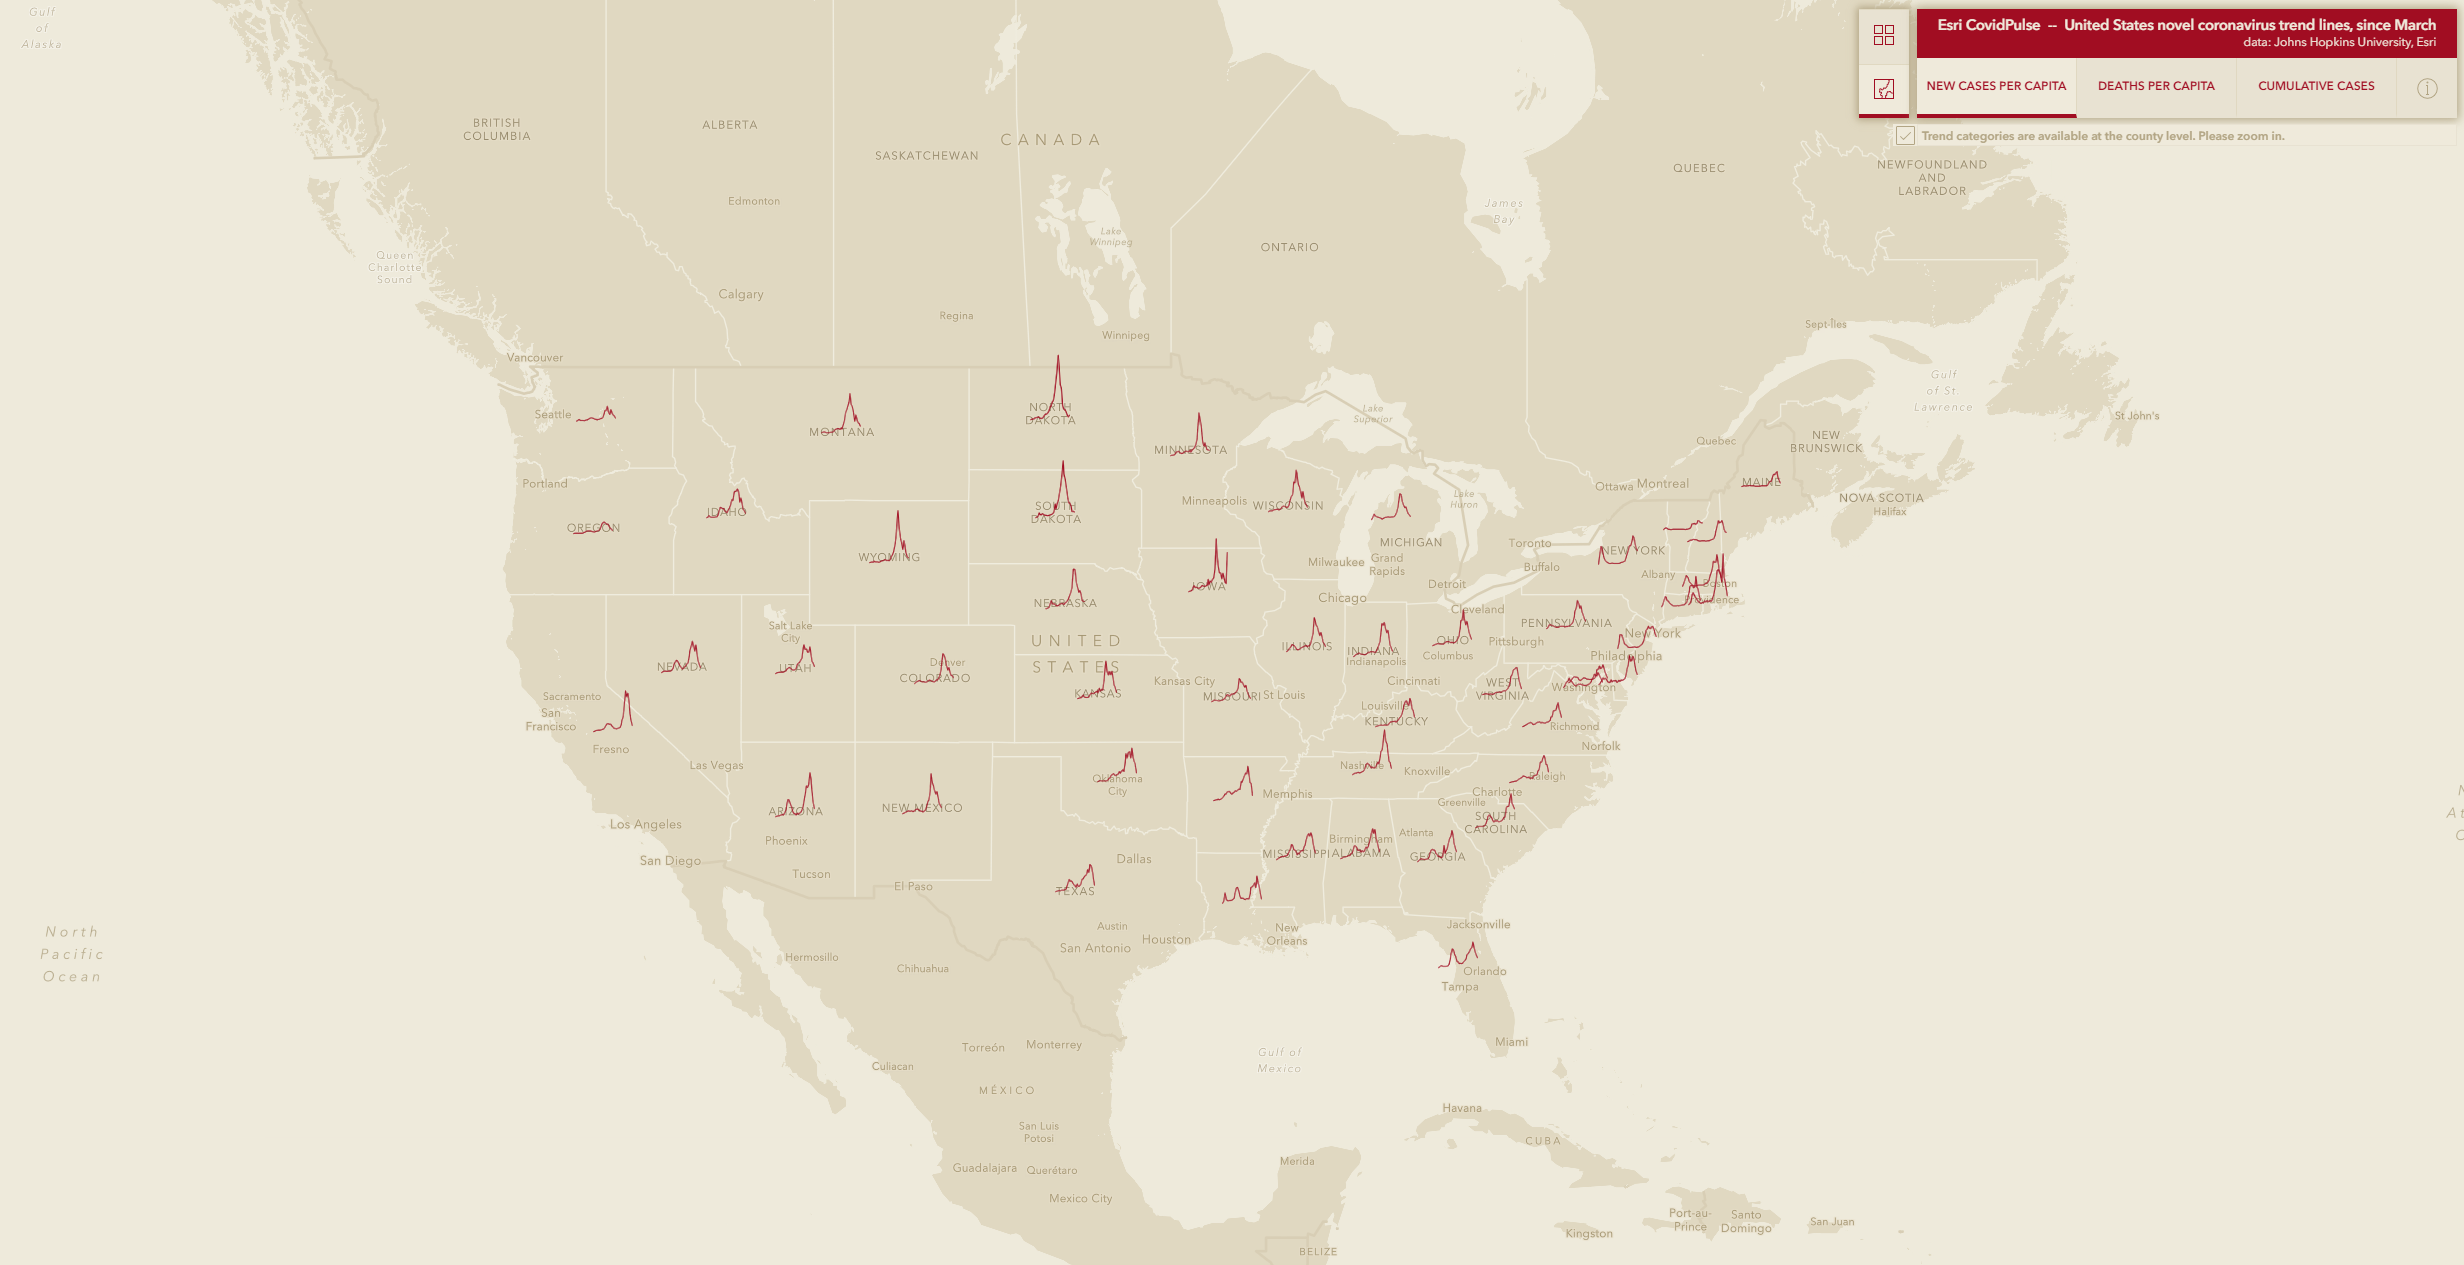
Esri’s CovidPulse Dashboard (above) shows new cases per capita in each state. Image courtesy of Esri.
As we noted in a previous post, GIS tools like Esri’s CovidPulse Dashboard and the Johns Hopkins University tracking dashboard have helped with monitoring the spread of the virus. Other tools were used to distribute tests, like at Mayo Clinic’s Jacksonville, Florida campus, where autonomous vehicles delivered COVID-19 tests and medical supplies.
In distribution efforts, similar tools can be put to use for planning, tracking, and publicizing vaccine progress. GIS is well-suited as a tool for addressing location-based needs specific to vaccination efforts. By using different types of spatial data, vaccination efforts can be adjusted region by region or even city by city.
GIS’s ability to incorporate layered data means it is an excellent resource when finding and assigning vaccine administration sites. It can help to identify locations where ample cold storage exists while also identifying facility staffing levels and capacity for parking and foot traffic.
Decision-makers can plan for many different scenarios by leveraging spatial data. Knowing ahead of time what situations might cause cold storage to become limited, or where adverse weather conditions could spoil vaccine doses is invaluable information.
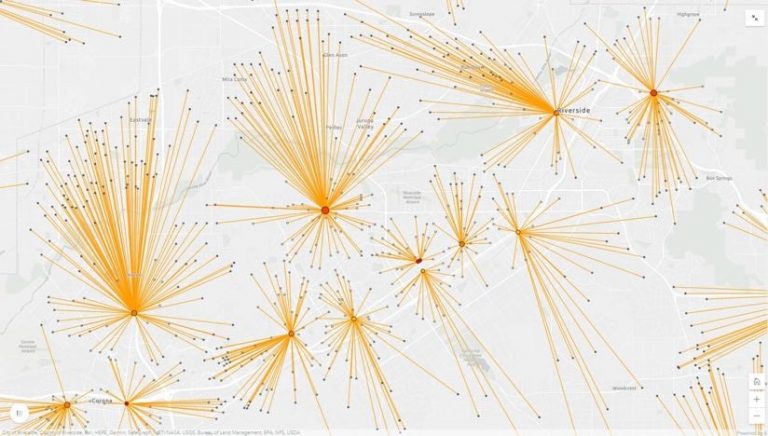
Spatial data is key to planning for optimal vaccine distribution. This is a sample vaccine venue map in which red dots indicate capacity for ultra-cold storage, and yellow dots indicate normal cold storage. Dot size indicates overall capacity. Lines represent drive time and distance to the potential distribution site from various population centers. Image courtesy of Esri.
Utilizing GIS in the planning stage also means decision-makers can learn where priority populations reside and design a vaccine distribution plan suited to reach them. Population data, layered under infrastructure data, can be used to ensure the most accessible sites are chosen. Physical distance may not always be the best indicator of accessibility, either – many datasets include information like bus routes, construction information, and languages preferences, among other factors that contribute to accessibility.
Once vaccines are being delivered and administered, location-based information can help develop a tracking system for who has taken both doses of the vaccine, as well as inventory management systems. This will decrease both confusion and wasted doses of the precious vaccines. This aspect also plays into a another important aspect of vaccine distribution: transparency.
Esri’s public-facing solution for the COVID vaccine, called the Coronavirus Vaccine Outreach solution, functions as a window into vaccination progress. It can be used to informally track progress, but also to illustrate official decisions and the rationale behind them. Official announcements paired with visible data help create a path toward greater trust between communities and their leaders. These kinds of solutions can also help individuals determine their eligibility for vaccination and find the best location to receive one, should they qualify.